Introduction As my hobby of being involved in a soccer team, I wanted to analyze soccer matches from my video I took and make use of these data in our daily practice and in the next game. And if possible, I would like to share those analytical data within the team. It seems that there are various applications and services in the world that can do that, then I wonder what to choose, but those are usually paid apps/services, right? So, considering the team’s financial situation, and in my case, my motivation in the first place is my personal hobby, and considering the frequency of use, etc., I feel I don’t want to use it going so far as paying a monthly fee for it. So, instead of paying for it, I took a time to do analysis by myself. Using something like Excel, tapping the keyboard on each event, and recording each of the events. Then I made a table and graphed the data all together and made those visible… I was trying to do something like that. As you can see, it’s really hard, so to make things a little easier, I wrote a program to record and […]
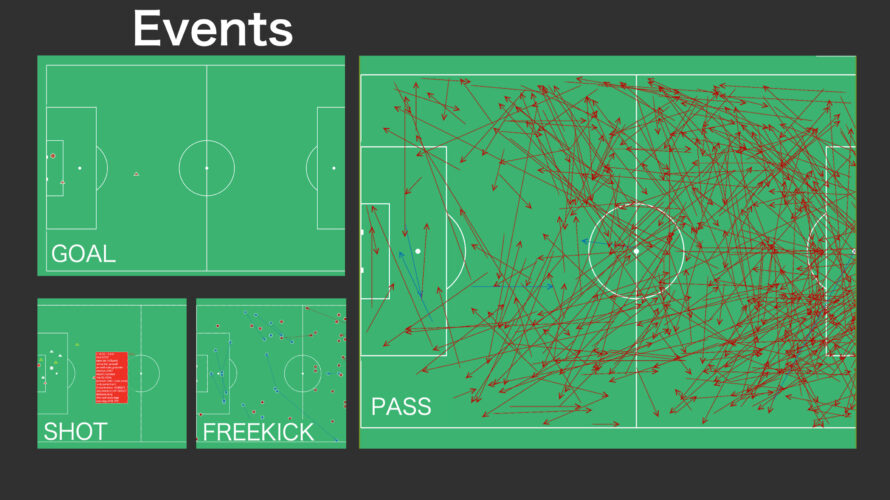
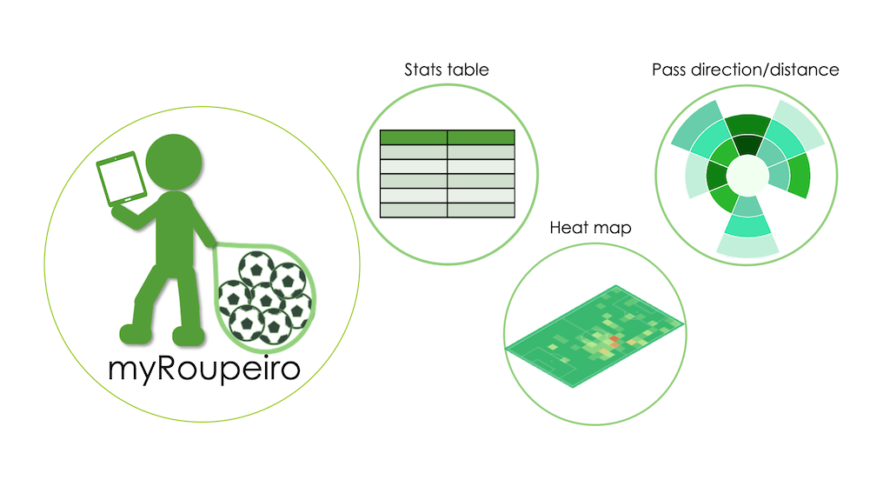
Japanese This article is for an older version. Please refer to the latest manual at the link below. What is myRoupeiro? “myRoupeiro” is a free app for supporting your video analysis of soccer matches. This program was originally created by the operator of this site (me) to support video analysis of our team’s matches. myRoupeiro is an application version that anyone can use. (android app only) Roupeiro (Portuguese) is an important behind-the-scenes support for a soccer team, meaning a soccer team’s equipment clerk. After that, named the app as myRoupeiro, hoping that it would be a useful tool to support your team. We hope you can use the data analyzed by myRoupeiro for your daily practice and the next game etc. It’s like this Visualize the events during the match Take a look at the team data Follow the events during the match in chronological order Notes How to use <Data recording> Record who, when, where and how was involved in the ball (we will call it an “event” here). Launch and exit the app Launch Just like launching a normal app, tap the icon to launch myRoupeiro exit Just like exiting a normal app, tap the Android task button […]
Background This post is a memo when I touched mplfinance and Plotly for graph drawing in Python. I tried creating a candlestick chart using a pandas DataFrame from a csv file of dollar-yen data in Python. When I googled how to do, I found that it could be easily drawn with mplfinance or Plotly, so I tried these, I was particularly surprised at the functionality of Plotly. First of all, when I was looking for something that could be drawn with matplotlib, I found out that there was something called mplfinance which is an update of the old version of mpl-finance (only the hyphen is different …) and seems to be easier to handle than mpl-finance. For more information please refer to GitHub. Also, I think I can draw a nice graph using Plotly (official site). From version 4, it seems that it is easier to use because it can be used for free (MIT license) without declaring the offline mode (https://plotly.com/python/is-plotly-free/) By the way, it seems that the functions of the former online mode have been separated and transferred to chart-studio. There are other similar tools such as seaborn and Bokeh, but I didn’t touch them because I felt […]