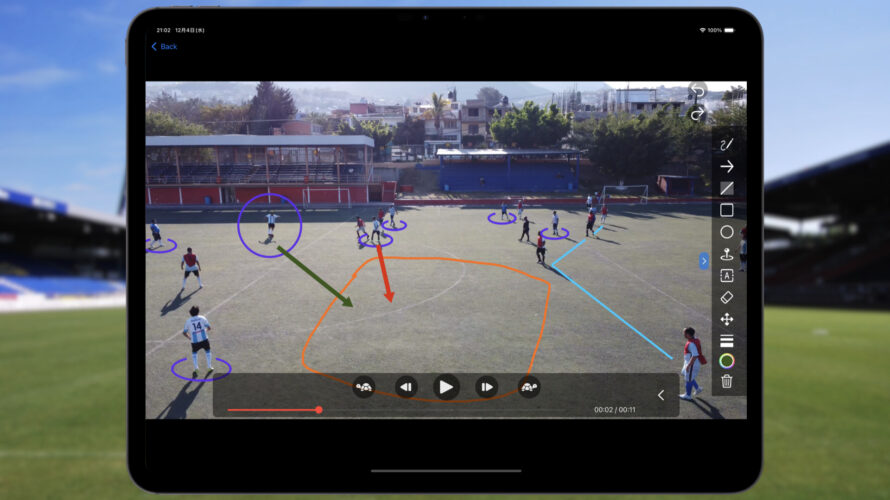
Japanese Introduction Clip-A-Doodle-Draw is a simple and intuitive telestration app (iOS) designed for sports coaches, players, and fans alike. With this app, you can draw directly on videos while watching them, visually sharing tactics and ideas in real-time to enhance communication effectiveness. Use Clip-A-Doodle-Draw to reflect on matches and training sessions, transforming your analysis experience into something deeper and more fulfilling! What Is a Telestration Tool? A telestration tool allows you to draw lines and shapes directly on videos or images, making it easier to visually convey information and ideas. While professional-grade tools with complex effects are often the go-to for analysts, Clip-A-Doodle-Draw was developed as a completely free, simple, and user-friendly alternative for anyone to enjoy. The Inspiration Behind the Development The story of Clip-A-Doodle-Draw begins with a common frustration on the field. During soccer team meetings, we often review match footage and discuss key moments. And here’s how those conversations tend to go: Coach: “We need to cover this space better.”Facilitator: “Where? Around here?” (circling with a laser pointer)Coach: “Yes, but a bit further forward.”Facilitator: “Oh, like here?” (circling again)Coach: “Uh, let me take the pointer. Right here—around this spot.” (briefly circling)Player: “Wait, where exactly?”Facilitator: “Um… here, I […]
Introduction As my hobby of being involved in a soccer team, I wanted to analyze soccer matches from my video I took and make use of these data in our daily practice and in the next game. And if possible, I would like to share those analytical data within the team. It seems that there are various applications and services in the world that can do that, then I wonder what to choose, but those are usually paid apps/services, right? So, considering the team’s financial situation, and in my case, my motivation in the first place is my personal hobby, and considering the frequency of use, etc., I feel I don’t want to use it going so far as paying a monthly fee for it. So, instead of paying for it, I took a time to do analysis by myself. Using something like Excel, tapping the keyboard on each event, and recording each of the events. Then I made a table and graphed the data all together and made those visible… I was trying to do something like that. As you can see, it’s really hard, so to make things a little easier, I wrote a program to record and […]
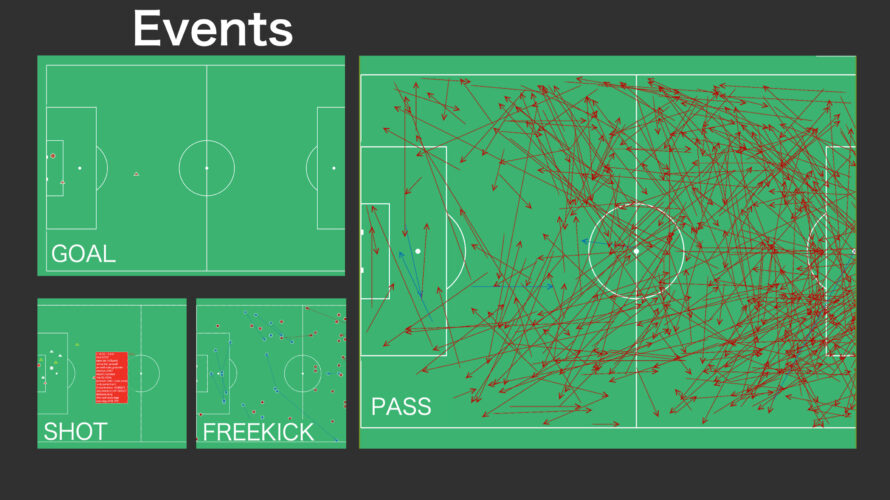
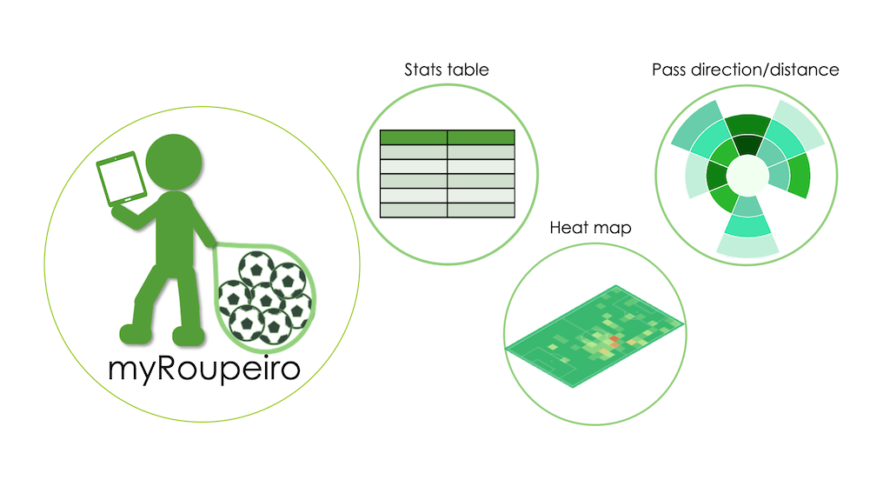
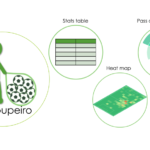
Japanese This article is for an older version. Please refer to the latest manual at the link below. What is myRoupeiro? “myRoupeiro” is a free app for supporting your video analysis of soccer matches. This program was originally created by the operator of this site (me) to support video analysis of our team’s matches. myRoupeiro is an application version that anyone can use. (android app only) Roupeiro (Portuguese) is an important behind-the-scenes support for a soccer team, meaning a soccer team’s equipment clerk. After that, named the app as myRoupeiro, hoping that it would be a useful tool to support your team. We hope you can use the data analyzed by myRoupeiro for your daily practice and the next game etc. It’s like this Visualize the events during the match Take a look at the team data Follow the events during the match in chronological order Notes How to use <Data recording> Record who, when, where and how was involved in the ball (we will call it an “event” here). Launch and exit the app Launch Just like launching a normal app, tap the icon to launch myRoupeiro exit Just like exiting a normal app, tap the Android task button […]
Background This post is a memo when I touched mplfinance and Plotly for graph drawing in Python. I tried creating a candlestick chart using a pandas DataFrame from a csv file of dollar-yen data in Python. When I googled how to do, I found that it could be easily drawn with mplfinance or Plotly, so I tried these, I was particularly surprised at the functionality of Plotly. First of all, when I was looking for something that could be drawn with matplotlib, I found out that there was something called mplfinance which is an update of the old version of mpl-finance (only the hyphen is different …) and seems to be easier to handle than mpl-finance. For more information please refer to GitHub. Also, I think I can draw a nice graph using Plotly (official site). From version 4, it seems that it is easier to use because it can be used for free (MIT license) without declaring the offline mode (https://plotly.com/python/is-plotly-free/) By the way, it seems that the functions of the former online mode have been separated and transferred to chart-studio. There are other similar tools such as seaborn and Bokeh, but I didn’t touch them because I felt […]
This is a memo of how to remove the duplicate list and put it together in Python two-dimensional list (list in list) Introduction Two-dimensional lists that have a duplicate list like this…. (The list is a and b respectively) [['01', '02', '03', '04'], ['11', '12', '13', '14']] ['11', '12', '13', '14'], ['21', '22', '23', '24']] I want to eliminate duplication and add them together as follows. [['01', '02', '03', '04'], ['11', '12', '13', '14'], ['21', '22', '23', '24']] But adding a and b normally, the duplication will remain like this. .. .. [ ['01', '02', '03', '04'], ['11', '12', '13', '14'], ['11', '12', '13', '14'], ['21', '22', '23', '24'] ] If this is a one-dimensional list, it can be achieved to remove duplicates with set function and then to convert result to the list, this way is often come up when I google how to remove duplication. {'01', '02', '03', '04', '11', '12', '13', '14', '21', '22', '23', '24'} ['11', '03', '01', '04', '21', '22', '12', '02', '13', '14', '23', '24'] #The original order is ignored. Set function doesn’t work for a two-dimensional list (list in list). So have to do it another way. After all, using a for loop […]
Introduction I installed tqdm to see progress bars in the Jupyter notebook. However when I use tqdm normally for nested “for statements”, full of progress bars are displayed…. So, this post is about a way to make tqdm on the Jupyter notebook easier to see. install tqdm I have installed tqdm with pip in the terminal (because I manage packages with pip). pip install tqdm full of progress bars… then, Using tqdm normally for nested “for statements”, it seems to be output every time the situation is updated, so it is hard to see because it comes out in a row….Oh my…. Use tqdm.notebook to avoid clutter Just use tqdm.notebook instead of normal tqdm. It becomes much easier to see and look better. Adding “leave = False”, it will be more simple-looking. As a side note, in order to use tqdm with pandas data, just type; Other notes It seems to use tqdm.notebook now It seems that tqdm_notebook have been used until a while ago, so even on the sites I referred to, But as use of tqdm_notebook, the following warning will appear. TqdmDeprecationWarning: This function will be removed in tqdm==5.0.0 Please use `tqdm.notebook.tqdm` instead of `tqdm.tqdm_notebook` Although we can […]
Introduction I almost always feel confused about pandas.DatetimeIndex when I set DatetimeIndex in pandas. More, I tend to drown in the sea of superabundant information, so I decided to make personal notes here. Click the table of contents to jump to the relevant item! For more details, please check official pandas website. Data used for case studies and versions of pandas and Python This post uses the following DataFrame as variable name “df”. First of all, let’s make sure the data type of index is DatetimeIndex. print(df.index) DatetimeIndex(['2020-01-02 03:04:05', '2021-06-07 08:09:10','2022-11-12 13:14:15'], dtype='datetime64[ns]', name='YMDHMS', freq=None) Good good. Then versions of pandas and Python are 0.24.2 and 3.7.2 respectively. * ‘Extract “day of the week” as a string; day_name ()’ was curried out in pandas 1.0.5 (added on June 26, 2020) しときます。 Well then, prepare in advance; import pandas as pd import datetime Case studies Confirming DataFrame configuration; index, columns, values and name print(df.index) #confirm index DatetimeIndex(['2020-01-02 03:04:05', '2021-06-07 08:09:10', '2022-11-12 13:14:15'], dtype='datetime64[ns]', name='YMDHMS', freq=None) print(df.columns) #confirm columns Index(['a', 'b', 'c'], dtype='object')df.values print(df.index.name) #confirm index name 'YMDHMS' print(df.values) #confirm values array([['a0', 'b0', 'c0'], ['a1', 'b1', 'c1'], ['a2', 'b2', 'c2']], dtype=object) print(df.columns.name) # confirm column names None 指定した行番号のindex名を表示, index Print the index […]
Introduction This is a memorandum about reading a csv file with read_csv of Python pandas with multiple delimiters. specifying the delimiter using sep (or delimiter) with stuffing these delimiters into “[]” So I’ll try it right away. Details Suppose I have the following csv file (tempo.csv) and I want to read it as separated with some delimiters (the right side of the time has a tab). s1,s2;s3,datetime f1,f2,f3 a,b;c,2020/07/27 03:00 1.2,3.4,5.6 d,e;f,2021/09/28 13:03 2.3,4.5,6.7 g,h;i,2022/11/29 23:45 3.4,5.6,7.8 Here, let’s use the following seven types of delimiters to separate them. “,” “;” “/” ” ” (space) “:” “t”(tab) “.” How to specify the delimiter with sep (or delimiter) is just writing multiple delimiters in [] like this. sep = “[]” And specify engine =’python’ together. Done! By the way, if you read a file without specifying anything, the default delimiter will be “,” Therefore It will be like above. And more;reorder header You may already know by now… Reading a csv file as divided by multiple delimiters, the column header will be shifted and indexed weirdly…. So, replace the header with a list of column names according to the newly generated columns. All done! Reference site. Thank you.https://stackoverflow.com/questions/26551662/import-text-to-pandas-with-multiple-delimitershttps://pandas.pydata.org/pandas-docs/stable/reference/api/pandas.read_csv.html?highlight=delimiter%20csv […]
Googleカレンダーの見た目を自分好みにカスタマイズして、印刷する方法です。

