Draw a candlestick chart with mplfinance and Plotly
- 2021.10.28
- Plotly Python 使いかた備忘録
- candlestick, mplfinance, pandas, plotly, python

Background
This post is a memo when I touched mplfinance and Plotly for graph drawing in Python.
I tried creating a candlestick chart using a pandas DataFrame from a csv file of dollar-yen data in Python.
When I googled how to do, I found that it could be easily drawn with mplfinance or Plotly, so I tried these, I was particularly surprised at the functionality of Plotly.
First of all, when I was looking for something that could be drawn with matplotlib, I found out that there was something called mplfinance which is an update of the old version of mpl-finance (only the hyphen is different …) and seems to be easier to handle than mpl-finance.
For more information please refer to GitHub.
Also, I think I can draw a nice graph using Plotly (official site).
From version 4, it seems that it is easier to use because it can be used for free (MIT license) without declaring the offline mode (https://plotly.com/python/is-plotly-free/)
By the way, it seems that the functions of the former online mode have been separated and transferred to chart-studio.
There are other similar tools such as seaborn and Bokeh, but I didn’t touch them because I felt it was a little difficult for me as a beginner.
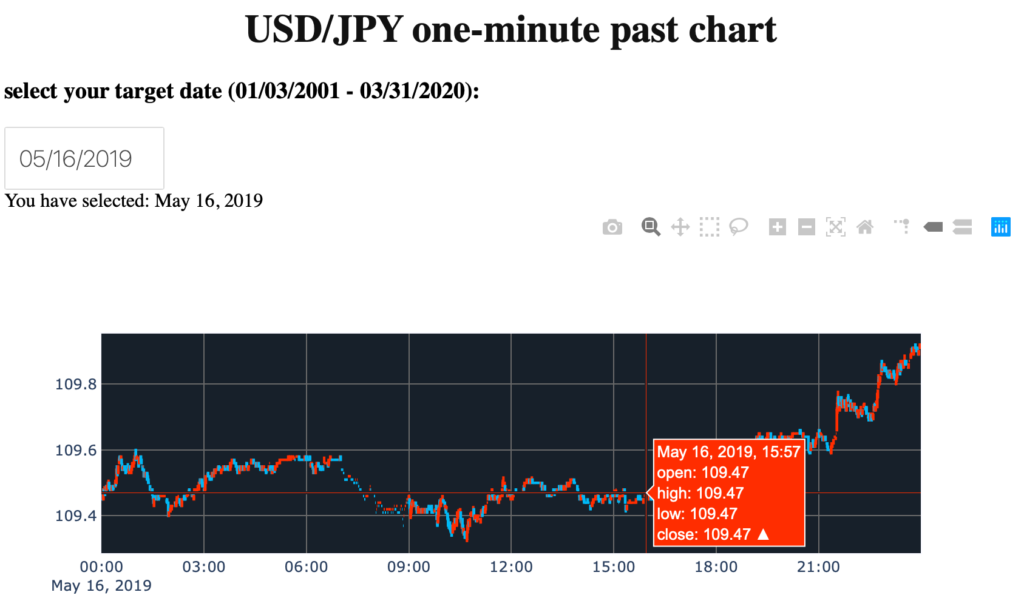
Related article regarding a web app made with Plotly (Japanese);https://vucavucalife.com/usdjpy-past-one-minute-chart2/
Procedure
Data preparation
I downloaded the csv file of the past dollar-yen data from here.
Dollar-yen 1-minute data (Period 2001.1.2-2020.3.31. Missing data)
Price; bid
Time; GMT (UTC + 0000).
The amount of data is too large for a lesson, so I extracted only 20 minutes data from 00:00 on September 16, 2008 and used it as 20080916.csv.
First, load the csv file with DASK. At that time, converted the date and time to datetime type and set it to an index (Datetimeindex) as “hiduke”.
Then I converted GMT to JST.
# import pandas
import pandas as pd

#import DASK (used to improve csv loading speed) as ddf
import dask.dataframe as ddf
import dask.multiprocessing

# <DTYYYYMMDD> and <TIME> are collectively converted to datetime type with index as "hiduke".
#read a file with dask > Indexing > Convert to Panda Dataframe
df = ddf.read_csv("20080916.csv", sep="," , parse_dates={'hiduke':['<DTYYYYMMDD>', '<TIME>']})
df = ddf.read_csv("20080916.csv", sep="," , parse_dates={'hiduke':['<DTYYYYMMDD>', '<TIME>']}).set_index('hiduke')
df = df.compute()

#converted GMT(UTC + 0000) to JST(UTC + 0900)
df.index = df.index.tz_localize('UTC')
df.index = df.index.tz_convert('Asia/Tokyo')

#Since the TICKER and VOL columns are not used, drop them. Then complete data shaping.
df.drop(['<TICKER>', '<VOL>'], axis=1, inplace=True)

#Check the first 5 lines
print(df.head(5))
<OPEN> <HIGH> <LOW> <CLOSE>
hiduke
2008-09-16 09:00:00+09:00 104.17 104.21 104.14 104.21
2008-09-16 09:01:00+09:00 104.20 104.22 104.18 104.22
2008-09-16 09:02:00+09:00 104.21 104.25 104.21 104.22
2008-09-16 09:03:00+09:00 104.23 104.31 104.22 104.27
2008-09-16 09:04:00+09:00 104.25 104.29 104.25 104.29So, now ready to use DataFrame as df.
Install mplfinance
pip install mplfinanceIt may be needless to say, but at first I was trying to use mpl-finance, so
pip install mpl_financeI was trying to install mpl-finance and import it, I got warning as below;
##   WARNING: `mpl_finance` is deprecated:
##   Please use `mplfinance` instead (no hyphen, no underscore).
##   To install: `pip install --upgrade mplfinance`
##   For more information, see: https://pypi.org/project/mplfinance/
Therefore,
pip install --upgrade mplfinanceas I installed and used mplfinance.
At that time, I knew that mpl-finance had been renewed to mplfinance….
mplfinance code and execution result
I added the following code to the data acquisition code above and executed it together.
#import mplfinance
import mplfinance as mpf

# the column names must be Open, High, Low, Close, so change them.
df = df.rename
(columns = {'<OPEN>': 'Open', '<HIGH>': 'High', '<LOW>': 'Low', '<CLOSE>': 'Close'})

#draw with mplfinance
#draw using plot function specifying type as candle and style as starsandstripes.
mpf.plot(df, type='candle', style='starsandstripes')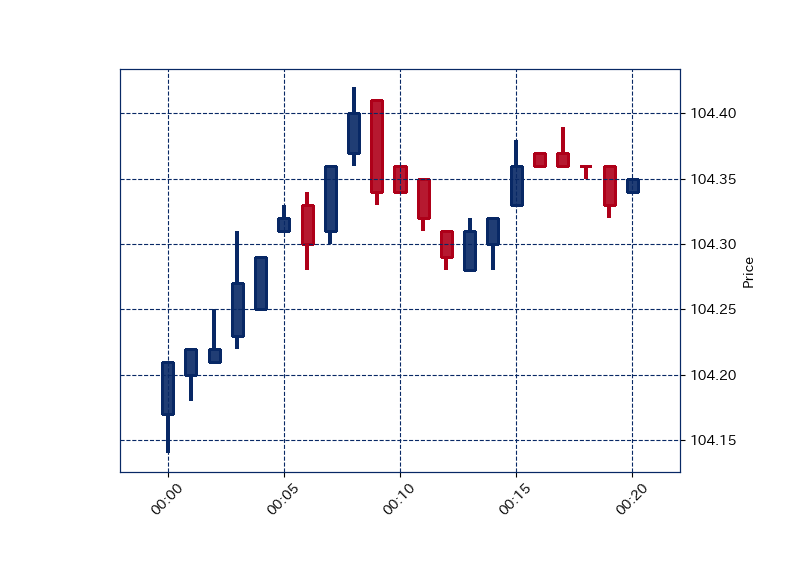
I was able to draw a good graph just with this simple code!
Looking closely, oh? It’s off 9 hours ago… Apparently it is treated as UCT even though it set JST.
I don’t know how to fix it with mlpfinance…. I will try adjust detail later….
Anyway, I found that I could easily draw an easy-to-read graph!
In addition,
mpf.available_styles()as we can see that the following styles are available.
['binance','blueskies','brasil','charles','checkers','classic','default', 'mike','nightclouds','sas','starsandstripes','yahoo']Next, install Plotly
pip install plotly==4.6.0I already installed the old version of 3.x.x (forgot), but this command will also uninstall the old version.
Plotly code and execution results
I added the following code under the mplfinance code and executed it together. So same DataFrame is used as df of which column name has been changed in advance.
#since plotly.graph_objs is used for drawing candlestick, import as go
import plotly.graph_objs as go

fig = go.Figure(data = [go.Candlestick(x = df.index,
    open = df['Open'],
    high = df['High'],
    low = df['Low'],
    close = df['Close'])])
fig.show()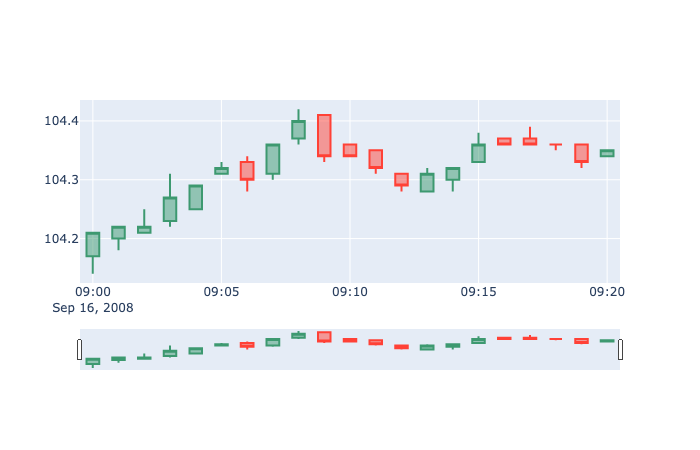
It was very easy as well!
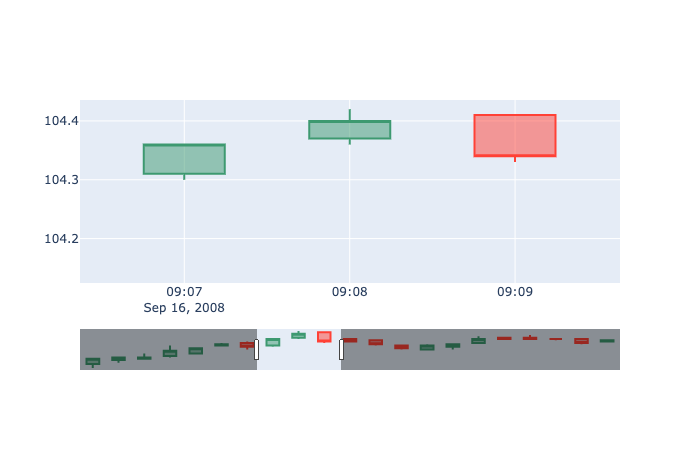
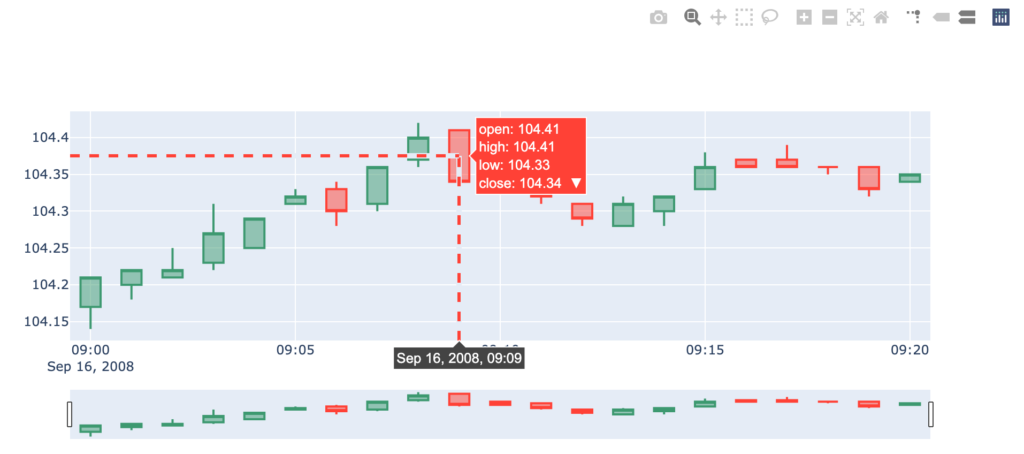
It seems to be very convenient to be able to change drawing range with the slider at the bottom and to check the value interactively with the mouse over.
Plotly seems keeping JST timezone.
Conclusion
In conclusion, it turned out that both of them can draw an easy-to-understand diagram with almost the default settings. Great….
In particular, Plotly seems to be very compatible with detailed analysis.
If I get any idea, I would like to try various other graphs, functions, and settings.
Environment
Python; 3.7.2
mplfinance; 0.12.4a0
Plotly; 4.6.0
<Additional note 1>
Styles of mplfinance candlestick
https://vucavucalife.com/python-mplfinance-candle-stick-style/
<Additional note 2>
Using Dash, I made a web application that can display the past dollar-yen candlestick chart (1 minute) in Plotly.
https://vucavucalife.com/usdjpy-past-one-minute-chart2/
ちょっと広告です
https://business.xserver.ne.jp/
https://www.xdomain.ne.jp/
★LOLIPOP★
.tokyo
MuuMuu Domain!