Introduction There are several ways to record your child’s or team’s soccer matches. You can use the iPhone you already have. You can use a dedicated video camera. Or you can invest in a sports camera that uses AI to automatically track the players. Each option has its own advantages. But when it comes to match videos, it’s worth thinking about not only how you record the game, but also what you do with the footage afterward. After putting in the effort to record a match, why not make the most of it? Rewatching goals, talking with your child about their play, or sharing great moments—and even mistakes—with the team can turn match footage into something more than just a record of the game. It can become a useful tool for learning, improvement, and development. In this article, we’ll look at the different ways to record soccer matches and then explore how you can use an iPhone or iPad to turn your match footage into something you can review and share. Different Ways to Record a Soccer Match There are several ways to record a soccer match, and each option has its own strengths. iPhone / iPad The easiest option […]
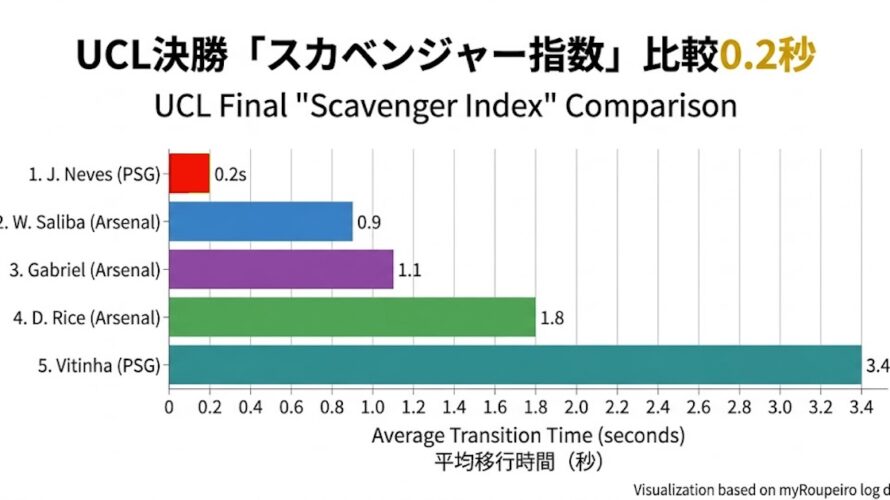
Introduction In the 2026 UEFA Champions League Final between Paris Saint-Germain (PSG) and Arsenal, a historic battle pushed the game into extra time and penalties. PSG ultimately clinched the title, securing their dominance in Europe with back-to-back championships. I recorded every ball-in-play event—a total of 1,687 actions—during the 90 minutes of regulation (103 minutes including stoppage time) using the app myRoupeiro. This article delves deeper into insights beyond what the app’s standard visualization can show. What emerged from this deep dive was not reflected in the flashy stats found on typical websites, but rather the sheer “will” of one young fighter: João Neves. Let’s peel back the layers behind his “28-second” performance. Note: This is an independent analysis and has no affiliation with any official data. It has not undergone formal quality control, and some insights are based on my own subjective interpretation. Please treat this data as a reference only. Additionally, please be aware that some parts of this article were generated with the assistance of AI.” The Protagonist of Just “28 Seconds” in a 103-Minute Battle The fierce battle, which lasted 103 minutes including stoppage time, was a test of endurance. Amidst this, João Neves held the ball […]
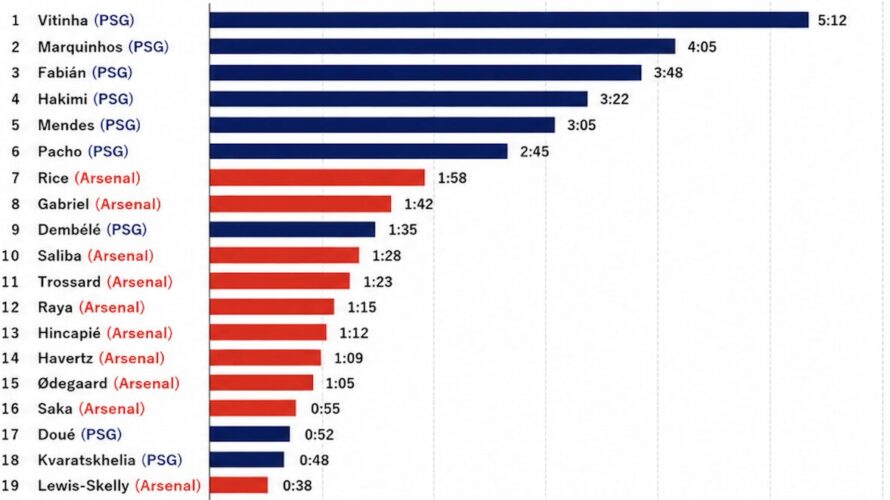
Introduction In a 90-minute football match, it is often said that the amount of time a single player spends in actual possession of the ball is surprisingly short. Johan Cruyff once remarked: “Players are in possession of the ball for an average of only three minutes. Therefore, what they do during the other 87 minutes is what matters most.” This highlights the critical importance of “off-the-ball” movement. The character Ego Jinpachi from the manga Blue Lock goes even further, providing a specific average value of “approximately 136 seconds (2 minutes and 16 seconds).” Recently, I decided to record every single play involving the ball during the first and second halves of the 2026 UCL Final (PSG vs. Arsenal), a stage where the world’s best compete. Since I had all this data, I took the logs of all 1,687 events and calculated the ball possession time for every player in seconds. And because I went to the trouble of doing that, I decided to do it for every individual player, not just the averages. Please note: I haven’t performed any strict quality control (QC), and there are some plays based on the data collector’s (my) subjective interpretation, so please take the […]
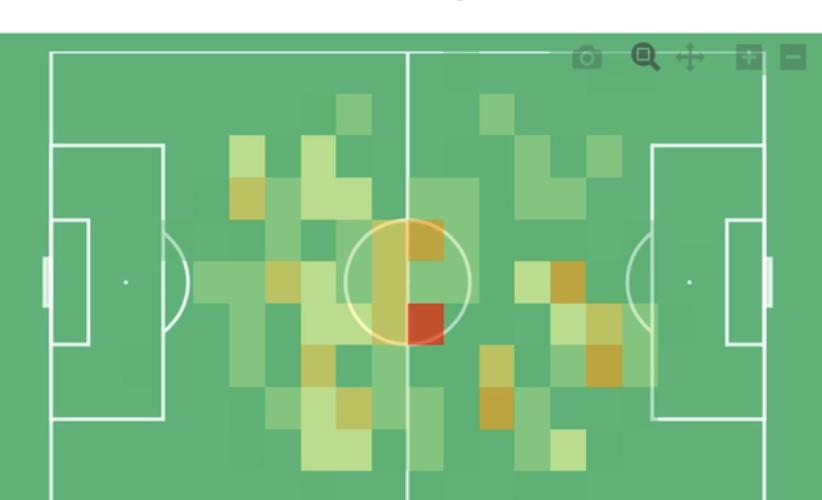
Introduction The 2026 UEFA Champions League (UCL) final between PSG and Arsenal was more than just a game; it was a tactical drama condensed into a single match. In this analysis, I have taken a light-hearted look at the match using data from all 1,687 events recorded(*). We will focus on Kai Havertz’s opening goal, powered by individual brilliance, and the astounding stats posted by the “Heart of PSG,” Vitinha. *Data was recorded and aggregated using the soccer match recording app “myRoupeiro,” tracking ball-involved plays in both halves. Non-official data. Excludes extra time. Includes some estimations for plays that could not be confirmed via video. 1. The Shocking 4 Seconds: Kai Havertz’s Individual Destruction The opening goal in the 5th minute shook the stadium, and the data shows it was the result of Havertz’s intense focus. Flowing the ball into the top corner of the near post with his left foot while under pressure from a defender, this play became a goosebump-inducing moment symbolizing Arsenal’s sharp transition from defense to attack. 2. Ultimate Symmetry: The “Perfect Circle” Drawn by Vitinha PSG’s aesthetic of possession revolved around one man: Vitinha. Phenomenal Stats He recorded the most passes of any player on […]
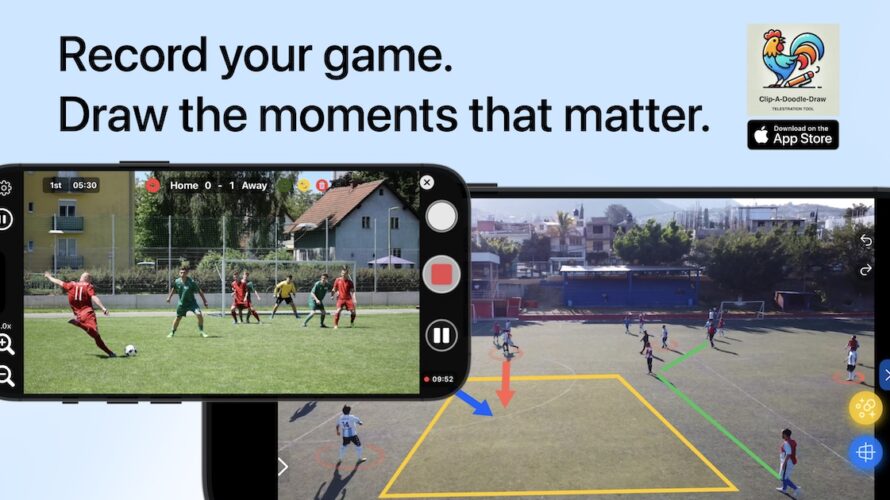
Japanese Introduction Clip-A-Doodle-Draw is a simple and intuitive telestration app (iOS) designed for sports coaches, players, and fans alike. With this app, you can draw directly on videos while watching them, visually sharing tactics and ideas in real-time to enhance communication effectiveness. With scoring and highlight timing saved during recording, reviewing your matches is now more efficient. Use Clip-A-Doodle-Draw to reflect on matches and training sessions, transforming your analysis experience into something deeper and more fulfilling! What Is a Telestration Tool? A telestration tool allows you to draw lines and shapes directly on videos or images, making it easier to visually convey information and ideas. While professional-grade tools with complex effects are often the go-to for analysts, Clip-A-Doodle-Draw was developed as a completely free, simple, and user-friendly alternative for anyone to enjoy. The Inspiration Behind the Development The story of Clip-A-Doodle-Draw begins with a common frustration on the field. During soccer team meetings, we often review match footage and discuss key moments. And here’s how those conversations tend to go: Coach: “We need to cover this space better.”Facilitator: “Where? Around here?” (circling with a laser pointer)Coach: “Yes, but a bit further forward.”Facilitator: “Oh, like here?” (circling again)Coach: “Uh, let me […]
Introduction As my hobby of being involved in a soccer team, I wanted to analyze soccer matches from my video I took and make use of these data in our daily practice and in the next game. And if possible, I would like to share those analytical data within the team. It seems that there are various applications and services in the world that can do that, then I wonder what to choose, but those are usually paid apps/services, right? So, considering the team’s financial situation, and in my case, my motivation in the first place is my personal hobby, and considering the frequency of use, etc., I feel I don’t want to use it going so far as paying a monthly fee for it. So, instead of paying for it, I took a time to do analysis by myself. Using something like Excel, tapping the keyboard on each event, and recording each of the events. Then I made a table and graphed the data all together and made those visible… I was trying to do something like that. As you can see, it’s really hard, so to make things a little easier, I wrote a program to record and […]
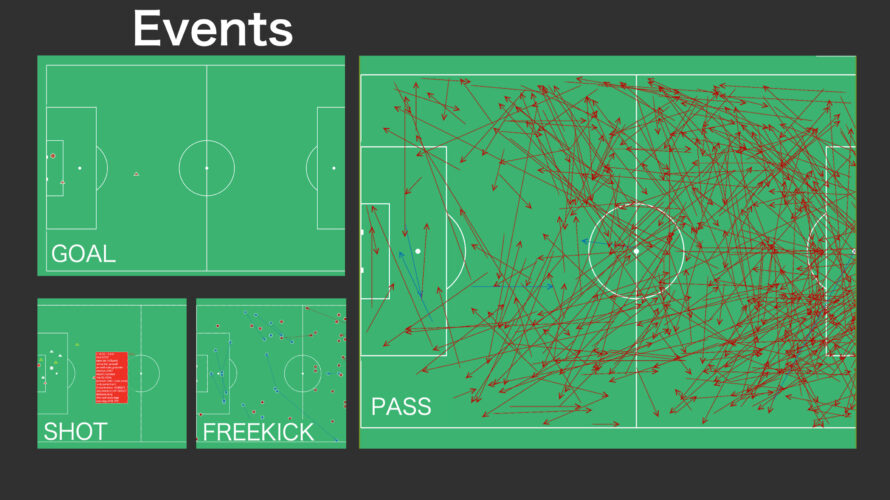
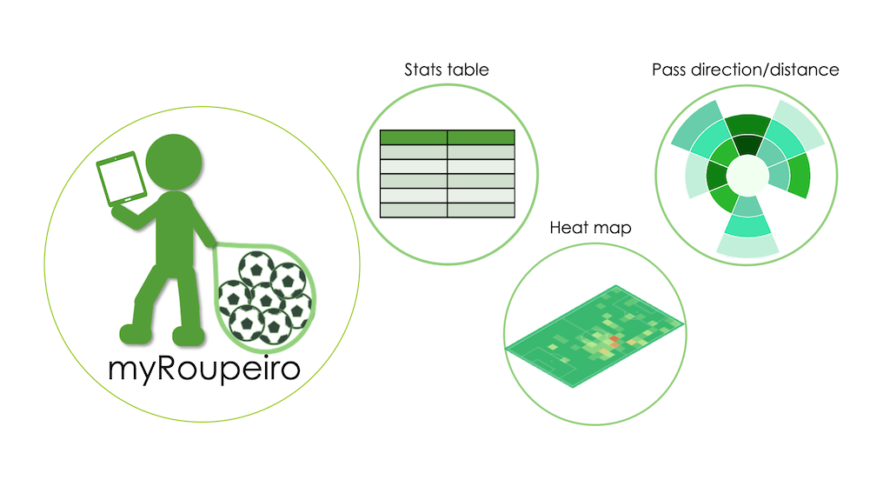
Japanese This article is for an older version. Please refer to the latest manual at the link below. What is myRoupeiro? “myRoupeiro” is a free app for supporting your video analysis of soccer matches. This program was originally created by the operator of this site (me) to support video analysis of our team’s matches. myRoupeiro is an application version that anyone can use. (android app only) Roupeiro (Portuguese) is an important behind-the-scenes support for a soccer team, meaning a soccer team’s equipment clerk. After that, named the app as myRoupeiro, hoping that it would be a useful tool to support your team. We hope you can use the data analyzed by myRoupeiro for your daily practice and the next game etc. It’s like this Visualize the events during the match Take a look at the team data Follow the events during the match in chronological order Notes How to use <Data recording> Record who, when, where and how was involved in the ball (we will call it an “event” here). Launch and exit the app Launch Just like launching a normal app, tap the icon to launch myRoupeiro exit Just like exiting a normal app, tap the Android task button […]
Background This post is a memo when I touched mplfinance and Plotly for graph drawing in Python. I tried creating a candlestick chart using a pandas DataFrame from a csv file of dollar-yen data in Python. When I googled how to do, I found that it could be easily drawn with mplfinance or Plotly, so I tried these, I was particularly surprised at the functionality of Plotly. First of all, when I was looking for something that could be drawn with matplotlib, I found out that there was something called mplfinance which is an update of the old version of mpl-finance (only the hyphen is different …) and seems to be easier to handle than mpl-finance. For more information please refer to GitHub. Also, I think I can draw a nice graph using Plotly (official site). From version 4, it seems that it is easier to use because it can be used for free (MIT license) without declaring the offline mode (https://plotly.com/python/is-plotly-free/) By the way, it seems that the functions of the former online mode have been separated and transferred to chart-studio. There are other similar tools such as seaborn and Bokeh, but I didn’t touch them because I felt […]
This is a memo of how to remove the duplicate list and put it together in Python two-dimensional list (list in list) Introduction Two-dimensional lists that have a duplicate list like this…. (The list is a and b respectively) [['01', '02', '03', '04'], ['11', '12', '13', '14']] ['11', '12', '13', '14'], ['21', '22', '23', '24']] I want to eliminate duplication and add them together as follows. [['01', '02', '03', '04'], ['11', '12', '13', '14'], ['21', '22', '23', '24']] But adding a and b normally, the duplication will remain like this. .. .. [ ['01', '02', '03', '04'], ['11', '12', '13', '14'], ['11', '12', '13', '14'], ['21', '22', '23', '24'] ] If this is a one-dimensional list, it can be achieved to remove duplicates with set function and then to convert result to the list, this way is often come up when I google how to remove duplication. {'01', '02', '03', '04', '11', '12', '13', '14', '21', '22', '23', '24'} ['11', '03', '01', '04', '21', '22', '12', '02', '13', '14', '23', '24'] #The original order is ignored. Set function doesn’t work for a two-dimensional list (list in list). So have to do it another way. After all, using a for loop […]
Introduction I installed tqdm to see progress bars in the Jupyter notebook. However when I use tqdm normally for nested “for statements”, full of progress bars are displayed…. So, this post is about a way to make tqdm on the Jupyter notebook easier to see. install tqdm I have installed tqdm with pip in the terminal (because I manage packages with pip). pip install tqdm full of progress bars… then, Using tqdm normally for nested “for statements”, it seems to be output every time the situation is updated, so it is hard to see because it comes out in a row….Oh my…. Use tqdm.notebook to avoid clutter Just use tqdm.notebook instead of normal tqdm. It becomes much easier to see and look better. Adding “leave = False”, it will be more simple-looking. As a side note, in order to use tqdm with pandas data, just type; Other notes It seems to use tqdm.notebook now It seems that tqdm_notebook have been used until a while ago, so even on the sites I referred to, But as use of tqdm_notebook, the following warning will appear. TqdmDeprecationWarning: This function will be removed in tqdm==5.0.0 Please use `tqdm.notebook.tqdm` instead of `tqdm.tqdm_notebook` Although we can […]