Plotlyのscatter plotでlineの先っぽに矢印をつけるの巻

はじめに
PlotlyのScatter plotを使ってプロットされた座標同士を線でつなぐ場合があるのですが、見た目に方向性を持たせたいときがあるぞ、と。
なので、線の先っぽに矢印をつけたい。どうしましょ、という話です。
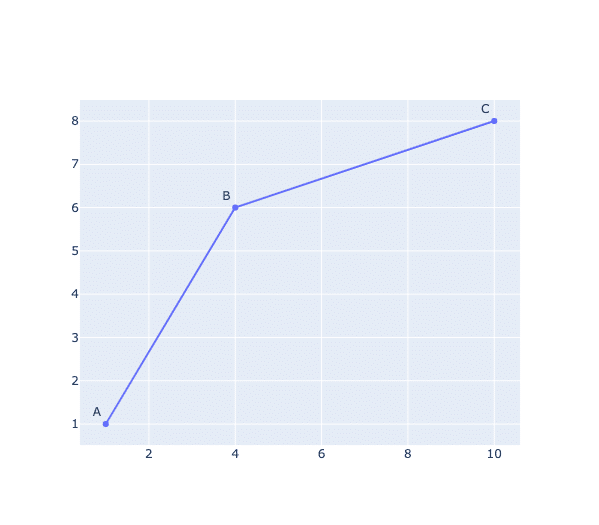
これを、
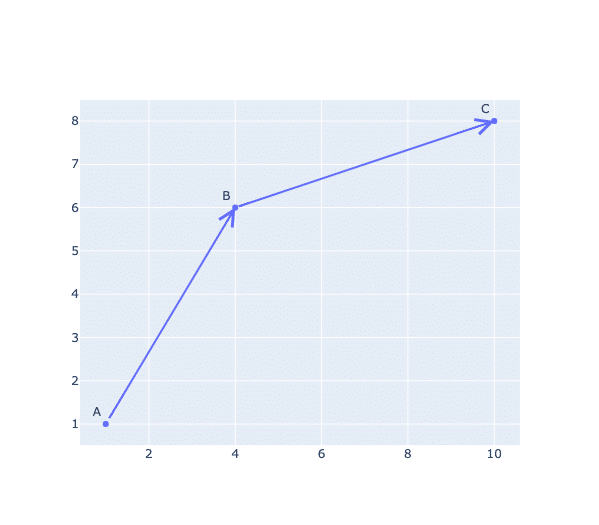
こうしたい、と。
そのやり方の備忘録です。
やりかた
text annotationsの矢印を使ってそれらしく描画してしまいます。
これのこと。
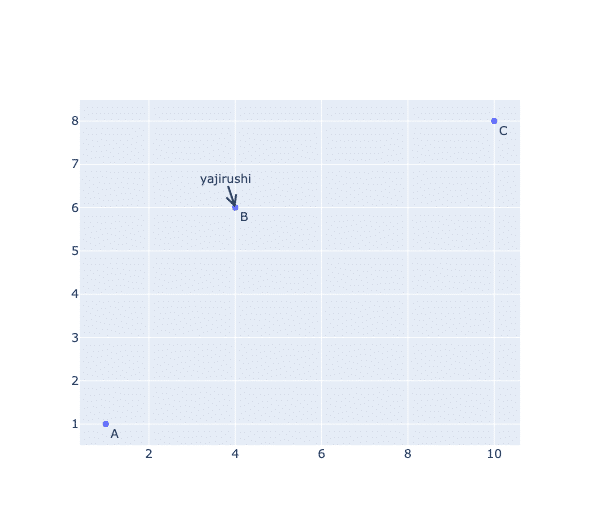
スマートじゃないと思うけど今のところ他に方法が見当たらないので。。。
以下でやってみます。
まずは普通にScatter plotを描画
まずは普通にScatter plotを描画してみます。linesとmarkersとtextで表現。
import plotly.graph_objects as go

x=[1, 4, 10]
y=[1, 6, 8]

fig = go.Figure()

fig.add_trace(go.Scatter(
    x=x,
    y=y,
    mode="lines+markers+text",
    text=["A", "B", "C" ],
    textposition="top left",
))

fig.show()
描けました。
矢印を追加します
これに矢印をつけるには、矢印のannotationの始点やら終点やら方向やらを、
もともとのデータの座標とぴったり合わせたものを作って追加してやればいいぞ、と。
というわけで先ほどのコードに追記したものを次に記載します。
import plotly.graph_objects as go


x=[1, 4, 10]
y=[1, 6, 8]

fig = go.Figure()

fig.add_trace(go.Scatter(
    x=x,
    y=y,
    mode="markers+text",
    text=["A", "B", "C" ],
    textposition="top left",
))


arrows =[
    go.layout.Annotation(dict(
        x=x[1], #x position of arrowhead
        y=y[1], #y position of arrowhead
        showarrow=True,
        xref = "x", #reference axis of arrow head coordinate_x
        yref = "y", #reference axis of arrow head coordinate_y
        arrowcolor="#636efa", #color of arrow
        arrowsize = 1.5, #size of arrow head
        arrowwidth = 2, #width of arrow line
        ax = x[0], #arrow tail coordinate_x
        ay = y[0], #arrow tail coordinate_y
        axref= "x", #reference axis of arrow tail coordinate_x
        ayref= "y", #reference axis of arrow tail coordinate_y
        arrowhead=5, #annotation arrow head style, from 0 to 8
        )),
    go.layout.Annotation(dict(
        x=x[2], #x position of arrowhead
        y=y[2], #y position of arrowhead
        showarrow=True,
        xref = "x", #reference axis of arrow head coordinate_x
        yref = "y", #reference axis of arrow head coordinate_y
        arrowcolor="#636efa", #color of arrow
        arrowsize = 1.5, #size of arrow head
        arrowwidth = 2, #width of arrow line
        ax = x[1], #arrow tail coordinate_x
        ay = y[1], #arrow tail coordinate_y
        axref= "x", #reference axis of arrow tail coordinate_x
        ayref= "y", #reference axis of arrow tail coordinate_y
        arrowhead=5, #annotation arrow head style, from 0 to 8
        ))
        ]

fig.update_layout(annotations=arrows)

fig.show()
コードの説明
・矢印のパラメータを記述したgo.layout.Annotaiton()を、arrowsというリストに格納してから(今回は矢印2本分)、fig.update_layout(annotations=arrows)のところで渡しています
・矢印のhead側とtail側の各座標をx, y と ax, ayで指定しています
・arrowcolorをlinesのデフォルトのcolor(#636efa)と合わせておくと違和感がないかと(もとの線を消してもあまり変わらないのでmodeからlinesを削除してもいいかも。ちょっと短くなるけど。)
・xref, yref, axref, ayrefにて、矢印の描画に使う座標軸を指定しています。今回はx軸とy軸は1つずつなので”x”, “y”しか選択肢がないですが、第2軸があって、第2軸を指定したい時は”x2”, “y2″としてやります
・arrowheadで矢印の先端の種類を[0-8]から選択します。矢印じゃないのもある。。。
・その他の各パラメータの説明はコード中のコメントをご参照ください
で、コードを実行すると、
無事描画できました。
矢印をいくつも描画したいとき
矢印にしたい線がいくつもある時は、それぞれの線に対して作った矢印のリストを作って、fig.update_layout()に渡してやればいいです。
こんな感じで。
import plotly.graph_objects as go

#coordinate lists (arrow head and arrow tail)
headpoint_list = [(3,3), (4,3), (5,3), (3,4), (5,4), (3,5), (4,5), (5,5)]
tailpoint_list = [(2,2), (4,2), (6,2), (2,4), (6,4), (2,6), (4,6), (6,6)]

#put go.Scatter() for each coordinate into a list
arrowhead_traces = [go.Scatter(
    x=[i[0]],
    y=[i[1]],
    mode="lines+markers"
    )
    for i in headpoint_list
    ]

arrowtail_traces = [go.Scatter(
    x=[i[0]],
    y=[i[1]],
    mode="markers"
    )
    for i in tailpoint_list
    ]

#merge
total_traces = arrowhead_traces + arrowtail_traces

#make a list of go.layout.Annotation() for each pair of arrow head and tail
arrows = [go.layout.Annotation(dict(
    x= head[0], #x position of arrowhead
    y= head[1], #y position of arrowhead
    showarrow=True,
    xref = "x", #reference axis of arrow head coordinate_x
    yref = "y",#reference axis of arrow head coordinate_y
    arrowcolor="#636efa", #color of arrow
    arrowsize = 1.5, #size of arrow head
    arrowwidth = 2, #width of arrow line
    ax = tail[0], #arrow tail coordinate_x
    ay = tail[1], #arrow tail coordinate_y
    axref= "x", #reference axis of arrow tail coordinate_x
    ayref= "y", #reference axis of arrow tail coordinate_y
    arrowhead=i, #annotation arrow head style, from 0 to 8
    text = 'style #'+str(i),
    ))
    for i, (head, tail) in enumerate(zip(headpoint_list, tailpoint_list))
    ]

#pass total_traces to go.Figure
fig = go.Figure(total_traces)

#update_layout with annotations
fig.update_layout(annotations=arrows)

fig.show()
コードの説明
・矢印を作るのに使う座標が取り出せれば基データはどんな形でもいいと思います
・それぞれの座標についてgo.Scatter()を作ってリスト化します。作ったリストをfig = go.Figure() のところで渡しています
・矢印のパラメータを記述したgo.layout.Annotaiton()を、それぞれの座標について作って、arrowsというリストに入れています。これをfig.update_layout(annotations=arrows)のところで渡しています
・今回、矢印9個分(矢印のスタイルの数)の座標ペアを使用したので、
for i, (head, tail) in enumerate(zip(headpoint_list, tailpoint_list))
のところで、zipで各座標リストからそれぞれの座標をheadとtailで取り出しています
ついでにenumerateで座標ペア分の数字(矢印のスタイル指定用)も取得しています
・取り出した矢印のhead側とtail側の各座標をx, y と ax, ayに代入しています
・矢印の先端の種類を指定するために、取得した数字をarrowheadに代入しています
・text = “style #”+str(i) スタイルの説明テキストの表示用
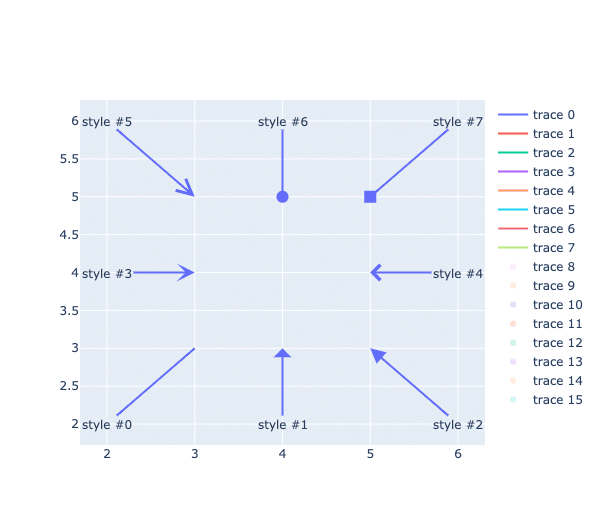
というわけで、ついでに矢印の種類も全部描画してみました。
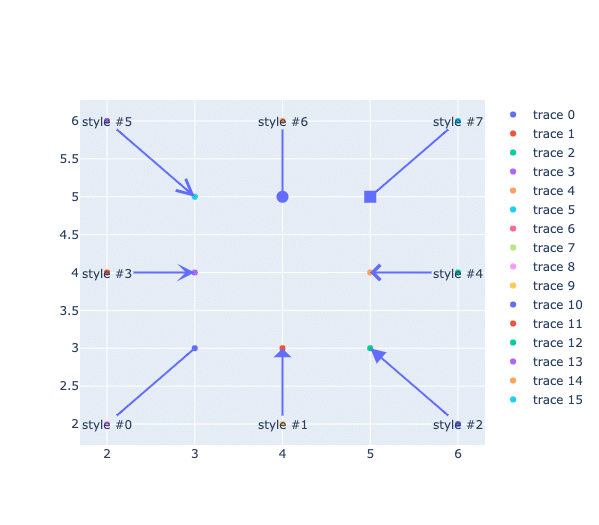
Markerを見えなくしたいときはmodeからmarkersを削除するか、markerのopacityを0に設定すればいいです。
改変部分を抜粋すると、
#coordinate lists (arrow head and arrow tail)
arrowhead_traces = [go.Scatter(
    x=[i[0]],
    y=[i[1]],
    mode="lines"
    )
    for i in headpoint_list
    ]

#put go.Scatter() for each coordinate into a list
arrowtail_traces = [go.Scatter(
    x=[i[0]],
    y=[i[1]],
    mode="lines+markers",
    marker={'opacity':0},
    )
    for i in tailpoint_list
    ]
で、こうなります。ちょっとすっきり。
おわりに
PlotlyのScatter plotの線を矢印にする方法でした。
なんか無理やり感が強いので、他にいい方法があればいいんですけど。
実施環境
Plotly 4.14.3
Python 3.9.4
Mac OS Catalina version 10.15.7
参考にしたページ
今回も感謝
Plotly公式サイト
https://plotly.com/python/text-and-annotations/
https://plotly.com/python/reference/layout/annotations/
Stack Overflow
https://stackoverflow.com/questions/58095322/draw-multiple-arrows-using-plotly-python
https://business.xserver.ne.jp/
https://www.xdomain.ne.jp/
★LOLIPOP★
.tokyo
MuuMuu Domain!