Plotlyのsubplotでtitleの重なりを解消の巻
はじめに
Plotlyで、subplotを使ってpieチャートを並べた時に、subplot_titlesで設定したタイトルがグラフ上の数値と被ってしまうケースがあったため、subplotのタイトルの位置をずらすことで対応しました。
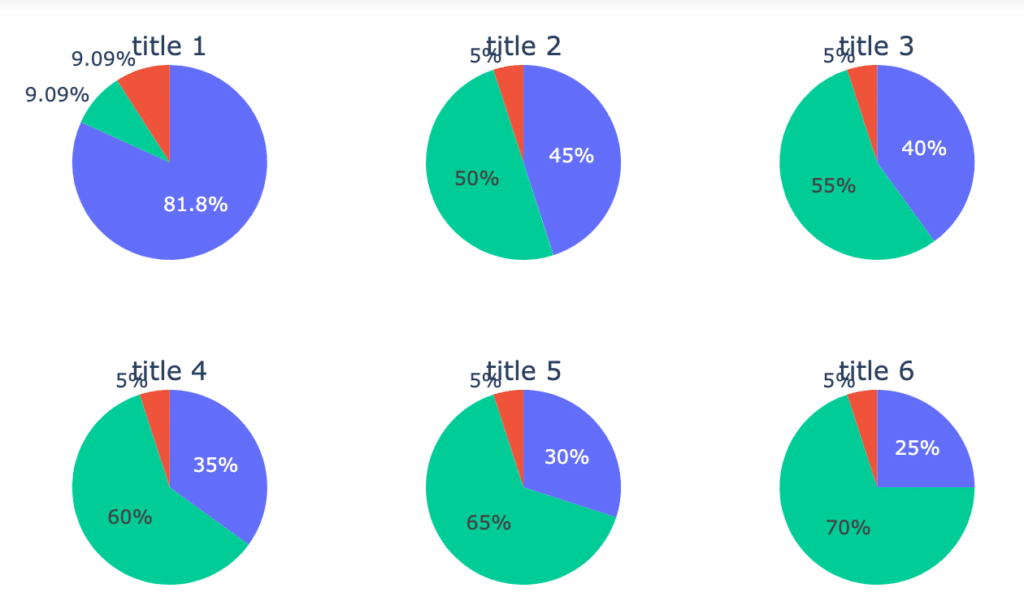
このように、subplotしたときのtitleがグラフのテキストに重なってしまって見にくいので。。。
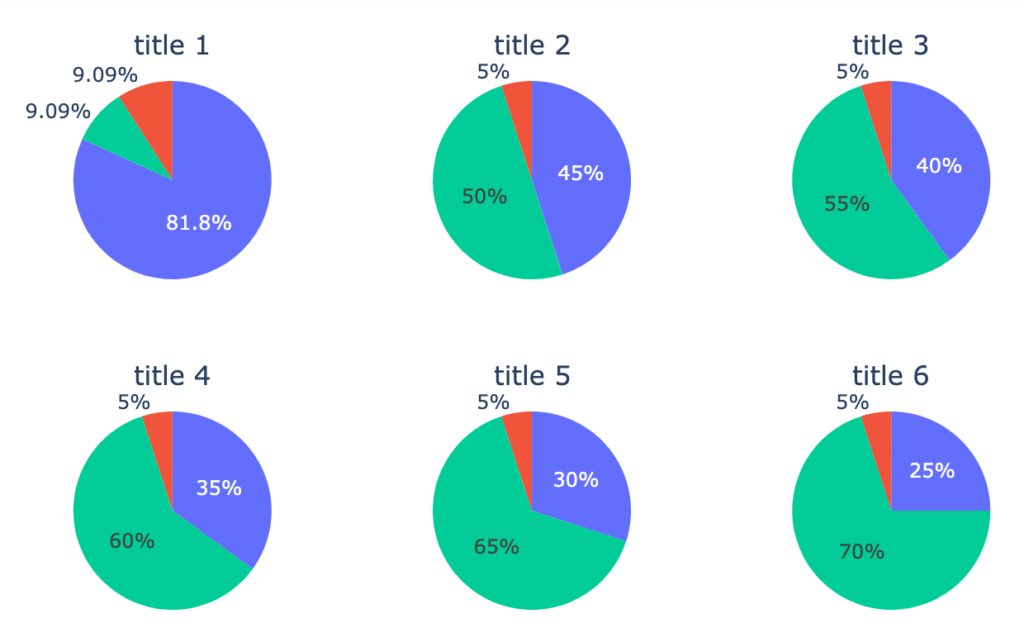
次のようにtitleの位置をずらして重ならないようにしました、という話。
グラフを描画するキャンバスのheightとwidthを大きくしてグラフ同士のソーシャルディスタンスを取るのが手っ取り早いかもですが、今回は限られた面積でグラフを並べることとの両立が必要だったので、タイトルの位置調整で対応しました。
というわけで、Plotlyのsubplotのtitleのalignmentの方法、の話です。
以下で実際にやった方法を記載します。
やり方
とりあえず現状を確認
まずはtitle位置修正前のコードを記載することを兼ねて、重なってしまっている状態のままでグラフを描いてみます。
subplot_titlesで各グラフのタイトルを付与しています。
from plotly.subplots import make_subplots
import plotly.graph_objects as go

fig = make_subplots(
    rows=2, cols=3, subplot_titles=('title 1', 'title 2', 'title 3','title 4', 'title 5', 'title 6'),
    specs=[[{"type": "domain"}, {"type": "domain"}, {"type": "domain"}],
          [{"type": "domain"}, {"type": "domain"}, {"type": "domain"}]]
)

fig.add_trace(go.Pie(values=[9, 1, 1]),
              row=1, col=1)

fig.add_trace(go.Pie(values=[9, 1, 10], sort = False),
              row=1, col=2)

fig.add_trace(go.Pie(values=[8, 1, 11], sort = False),
              row=1, col=3)

fig.add_trace(go.Pie(values=[7, 1, 12], sort = False),
              row=2, col=1)

fig.add_trace(go.Pie(values=[6, 1, 13], sort = False),
              row=2, col=2)

fig.add_trace(go.Pie(values=[5, 1, 14], sort = False),
              row=2, col=3)


fig.update_layout(height=500, showlegend=False)
fig.show()
このままだとtitleとグラフのテキストが重なってしまっています。
anotationsのパラメータを調整して位置を修正する
ここで、layoutの内容を見てやります。
fig.layoutすると、subplot_titlesで定義したタイトルそれぞれの情報が ‘anotations’ に入っていて、各タイトルの位置情報がxとyの座標で入っていることが確認できます。
例えば、
上段左のタイトル(title 1)は
x : 0.14444・・・
y : 1.0
下段右のタイトル(title 6)は
x : 0.85555・・・
y : 0.375
に置かれていることが分かりました(以下のfig.layout実行結果参照)。
Layout({
    'annotations': [{'font': {'size': 16},
                     'showarrow': False,
                     'text': 'title 1',
                     'x': 0.14444444444444446,
                     'xanchor': 'center',
                     'xref': 'paper',
                     'y': 1.0,
                     'yanchor': 'bottom',
                     'yref': 'paper'},
                    {'font': {'size': 16},
                     'showarrow': False,
                     'text': 'title 2',
                     'x': 0.5,
                     'xanchor': 'center',
                     'xref': 'paper',
                     'y': 1.0,
                     'yanchor': 'bottom',
                     'yref': 'paper'},
                    {'font': {'size': 16},
                     'showarrow': False,
                     'text': 'title 3',
                     'x': 0.8555555555555556,
                     'xanchor': 'center',
                     'xref': 'paper',
                     'y': 1.0,
                     'yanchor': 'bottom',
                     'yref': 'paper'},
                    {'font': {'size': 16},
                     'showarrow': False,
                     'text': 'title 4',
                     'x': 0.14444444444444446,
                     'xanchor': 'center',
                     'xref': 'paper',
                     'y': 0.375,
                     'yanchor': 'bottom',
                     'yref': 'paper'},
                    {'font': {'size': 16},
                     'showarrow': False,
                     'text': 'title 5',
                     'x': 0.5,
                     'xanchor': 'center',
                     'xref': 'paper',
                     'y': 0.375,
                     'yanchor': 'bottom',
                     'yref': 'paper'},
                    {'font': {'size': 16},
                     'showarrow': False,
                     'text': 'title 6',
                     'x': 0.8555555555555556,
                     'xanchor': 'center',
                     'xref': 'paper',
                     'y': 0.375,
                     'yanchor': 'bottom',
                     'yref': 'paper'}],
    'height': 500,
    'showlegend': False,
    'template': '...'
})
グラフの描画結果を見てやると、テキストとの重なりを解消するには、titleをy軸の正方向にちょっと動かしてやれば良さそうです。
なので各タイトルについて0.03だけy軸の正方向に動かした位置を指定して、グラフを更新してみます。
fig.layout.annotations[0].update(y=1.03)
fig.layout.annotations[1].update(y=1.03)
fig.layout.annotations[2].update(y=1.03)
fig.layout.annotations[3].update(y=0.405)
fig.layout.annotations[4].update(y=0.405)
fig.layout.annotations[5].update(y=0.405)
fig.show()
でけた。
このようにx,y座標をいじることでsubplotのtitleを所望の位置に動かすことができます。(試行錯誤は必要ですが)
というわけで、「Plotlyのsubplotでtitleの重なりを解消」する方法が見つかったのでした。
めでたしめでたし。
Python; 3.7.2
jupyter; 1.0.0
Plotly; 4.8.1
で実施しました。
参考にしたサイト。ありがとうございます。
https://community.plotly.com/t/subplot-title-alignment/33210/2
このブログはエックスサーバー
WordPressを使うならロリポップ!
簡単インストール完備で楽々スタート!
世界にたった一つ、あなただけのドメインを登録しよう!
格安ドメイン取得サービス─ムームードメイン─