PlotlyでBoxplotのtrace nameを消すの巻

はじめに
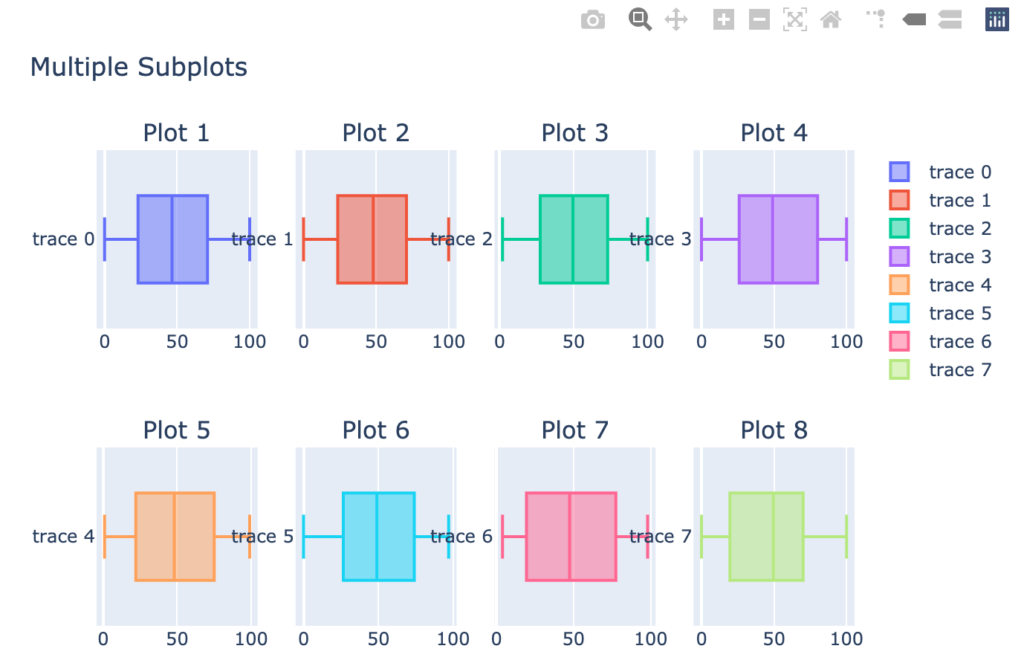
Plotlyのsubplotを使ってBoxplotを並べると、trace nameが隣のグラフと被ってしまう。。。指定方法がなかなかわからず彷徨いながらもtrace nameを消す方法にたどり着いたので忘れないようにメモ
という話。
やり方
layoutで、消したいtrace nameが属する軸 + subplotでの順番を指定して、
showticklabels = False
の状態にすればいいと。なので、y軸の1番目(yaxis1)であれば、Plotlyで描画するコードに
fig.update_layout(
yaxis1 = {"showticklabels":False})
を加えれば良いことがわかりました。ticklabelって言うんですね。。。
Boxplotのtrace nameを消す前のコードと結果
from plotly.subplots import make_subplots
import plotly.graph_objects as go
import random

fig = make_subplots(
    rows=2, cols=4,
    subplot_titles=("Plot 1", "Plot 2", "Plot 3", "Plot 4",
                   "Plot 5", "Plot 6", "Plot 7", "Plot 8"))

fig.add_trace(go.Box(x=[random.randint(0, 100) for i in range(100)]),
              row=1, col=1)

fig.add_trace(go.Box(x=[random.randint(0, 100) for i in range(100)]),
              row=1, col=2)

fig.add_trace(go.Box(x=[random.randint(0, 100) for i in range(100)]),
              row=1, col=3)

fig.add_trace(go.Box(x=[random.randint(0, 100) for i in range(100)]),
              row=1, col=4)

fig.add_trace(go.Box(x=[random.randint(0, 100) for i in range(100)]),
              row=2, col=1)

fig.add_trace(go.Box(x=[random.randint(0, 100) for i in range(100)]),
              row=2, col=2)

fig.add_trace(go.Box(x=[random.randint(0, 100) for i in range(100)]),
              row=2, col=3)

fig.add_trace(go.Box(x=[random.randint(0, 100) for i in range(100)]),
              row=2, col=4)


fig.update_layout(height=500, width=700,
                  title_text="Multiple Subplots")
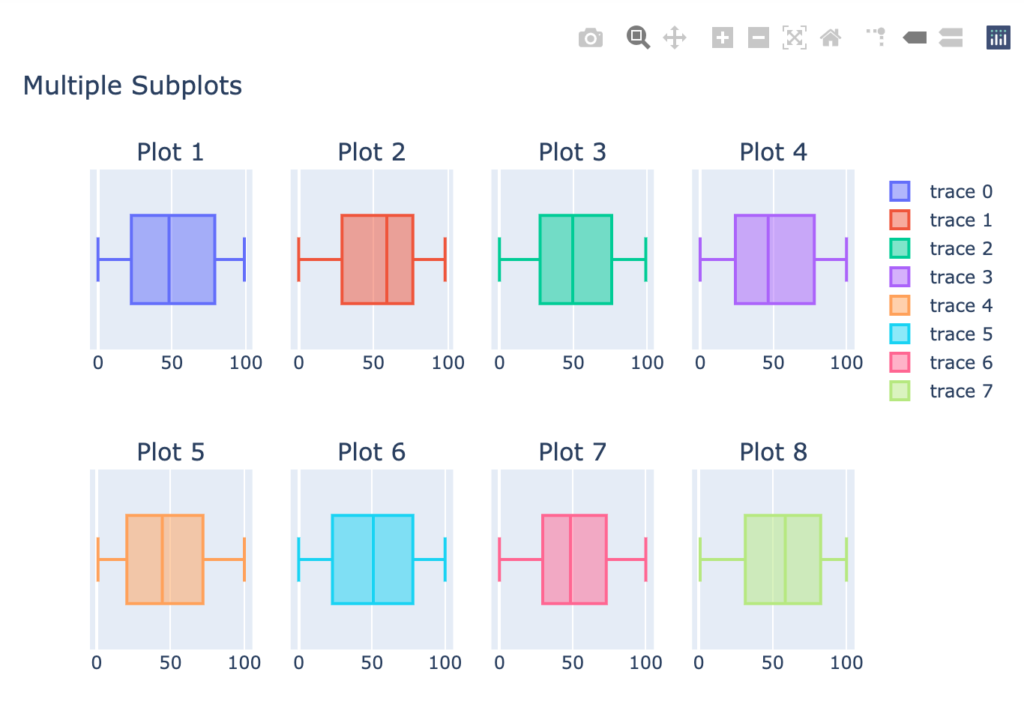
fig.show()Boxplotのtrace nameを消した後のコードと結果
fig.update_layout(
yaxis1 = {"showticklabels":False})
みたいに、消したい部分に対応させたものを記載するだけ。
from plotly.subplots import make_subplots
import plotly.graph_objects as go
import random

fig = make_subplots(
    rows=2, cols=4,
    subplot_titles=("Plot 1", "Plot 2", "Plot 3", "Plot 4",
                   "Plot 5", "Plot 6", "Plot 7", "Plot 8"))

fig.add_trace(go.Box(x=[random.randint(0, 100) for i in range(100)]),
              row=1, col=1)

fig.add_trace(go.Box(x=[random.randint(0, 100) for i in range(100)]),
              row=1, col=2)

fig.add_trace(go.Box(x=[random.randint(0, 100) for i in range(100)]),
              row=1, col=3)

fig.add_trace(go.Box(x=[random.randint(0, 100) for i in range(100)]),
              row=1, col=4)

fig.add_trace(go.Box(x=[random.randint(0, 100) for i in range(100)]),
              row=2, col=1)

fig.add_trace(go.Box(x=[random.randint(0, 100) for i in range(100)]),
              row=2, col=2)

fig.add_trace(go.Box(x=[random.randint(0, 100) for i in range(100)]),
              row=2, col=3)

fig.add_trace(go.Box(x=[random.randint(0, 100) for i in range(100)]),
              row=2, col=4)


fig.update_layout(height=500, width=700,
                  title_text="Multiple Subplots")

fig.update_layout(
yaxis1={"showticklabels":False},
yaxis2={"showticklabels":False},
yaxis3={"showticklabels":False},
yaxis4={"showticklabels":False},
yaxis5={"showticklabels":False},
yaxis6={"showticklabels":False},
yaxis7={"showticklabels":False},
yaxis8={"showticklabels":False})

fig.show()
でけた。めでたしめでたし。
Python; 3.7.2
jupyter; 1.0.0
Plotly; 4.8.1
で実施しました
参考にしたサイト。ありがとうございます
https://stackoverflow.com/questions/52082309/is-there-a-way-to-hide-trace-names-in-plotly-specifically-r
このブログはエックスサーバー
WordPressを使うならロリポップ!
簡単インストール完備で楽々スタート!
世界にたった一つ、あなただけのドメインを登録しよう!
格安ドメイン取得サービス─ムームードメイン─
日用品も洋服も、colleee経由で買うだけでお得に!