Python mplfinanceのcandlestickのstyleの巻
- 2020.07.12
- Python 使いかた備忘録
- mplfinance, python
タイトルママで、mplfinanceでローソク足(candlestick)チャートを描画した時のスタイルのメモです。
mplfinanceの詳細はGitHubにてご確認ください。
今回使用したデータ類に関するメモは記事の下部に記載しています。
では早速。
図がちょっと見切れてるのが気になりましたら脳内補完お願いします。
関連記事;過去20年分のドル円ローソク足チャートを1分足やら5分足やら日足やらで見れるやつを作ったの巻
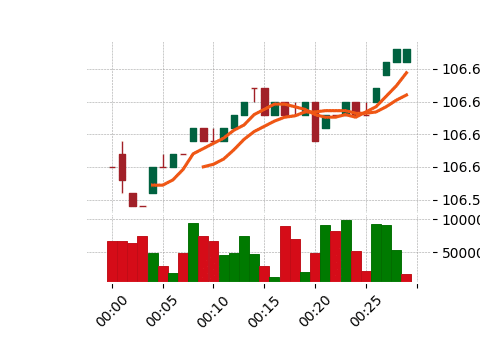
mplfinanceのcandlestickのstyle一覧
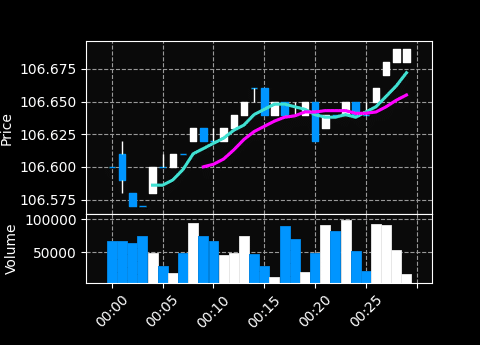
binance
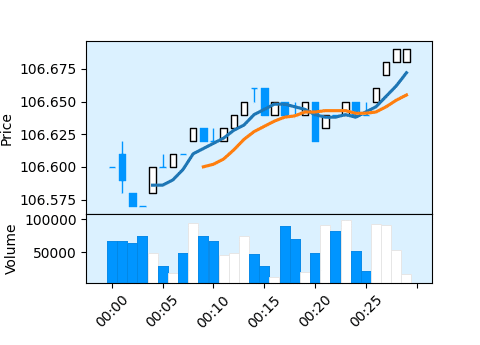
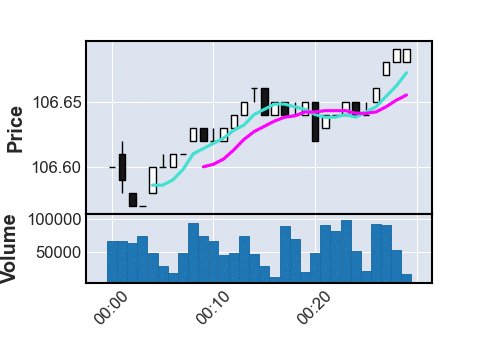
blueskies
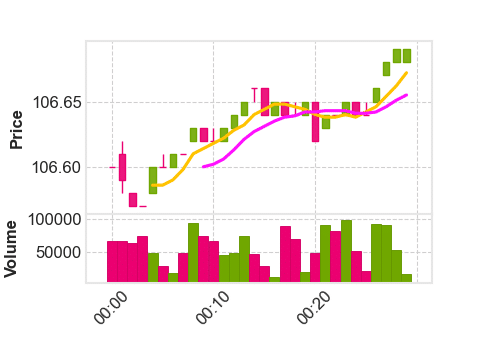
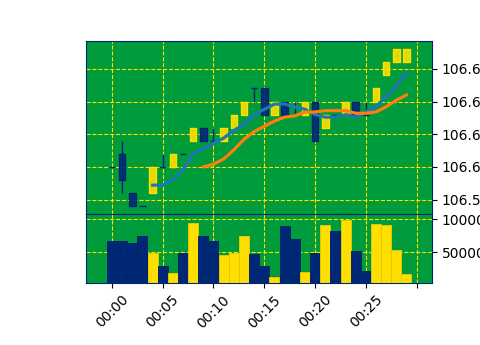
brasil
charles
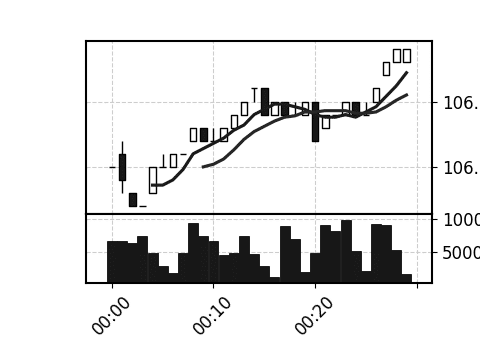
checkers
classic
default
mike
nightclouds
sas
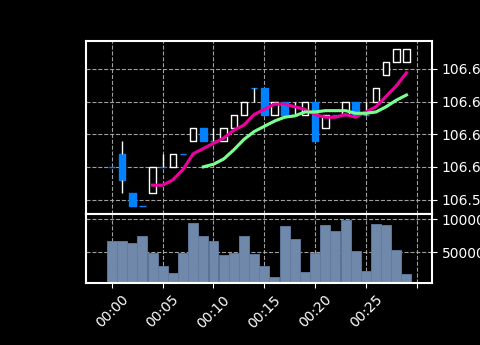
starsandstripes

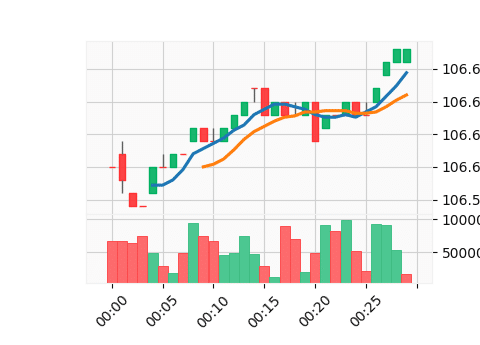
yahoo
以上のスタイルは、
mpf.available_styles()['binance','blueskies','brasil','charles','checkers','classic','default','mike','nightclouds','sas','starsandstripes','yahoo']
にて確認できます(mpfとしてmplfinanceをimportしていたら)
使用したデータとコード
過去のドル円データのcsvファイルをこちらからダウンロードさせていただいて、使用する分だけ抽出・加工しDataFrame(df)にして、今回使用しました。
ちなみに、
ドル円1分足データ
プライス;bid
時間;GMT (UTC+0000)
です。
display(df.shape)
display(df.head(3))
display(df.tail(3))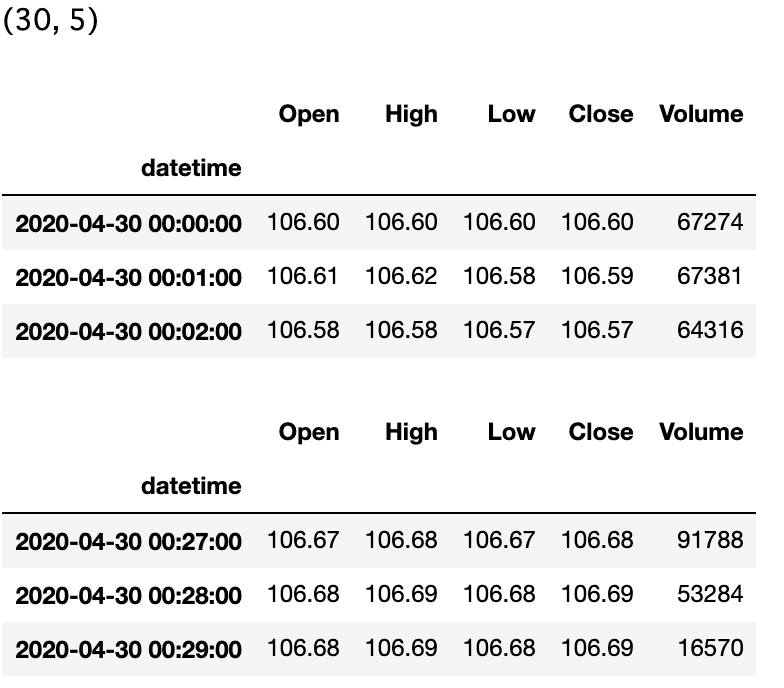
・カラム名はそれぞれOpen, High, Low, Close, Volumeと、決まったものにしないといけません。
今回使用したmplfinanceで描画するPythonのコードは以下です(dfはあらかじめ読み込んであるものとして。)
import pandas as pd     #pandasをpdとして読み込む
import mplfinance as mpf  #mplfinanceをimport

#figure sizeを調整
fig_scale = 0.6
fig_ratio = (8.00,5.75)

'''
If not specified, the default values (as of June 2020) are:
figscale = 1.0
figratio = (8.00,5.75)
'''


#plotでplot
mpf.plot(df, type='candle', style='starsandstripes', figscale = fig_scale, figratio = fig_ratio, volume = True, mav = (5, 10))
・type; グラフ種類を指定
・style; スタイルを指定
・figscale; defaultの1.0を基準にfigure sizeを変更
・figureratio; figureの縦横比を調整
・volume; 出来高(Volume)を描画*
・mav; 移動平均線を描画
*FXなので本当は出来高は無いのですが、どのように描画されるかっていうのを確認するため入れてます。
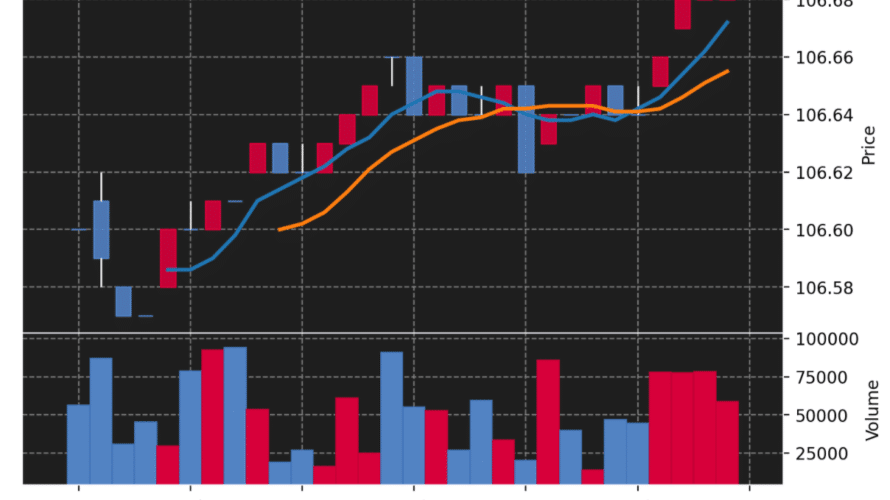
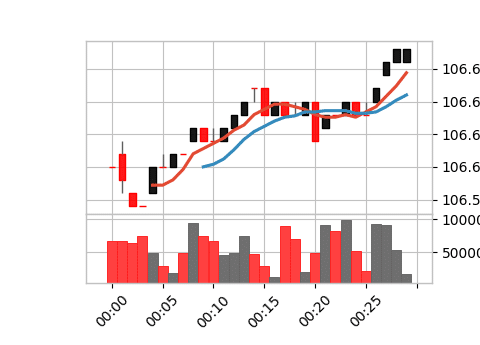
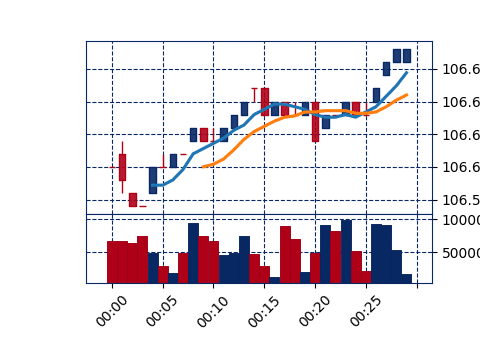
おまけ;もうちょっと色をいじってカスタムしてみる
ワタシとしては上昇が赤系で下降が青系の方がしっくりくるので、styleのcolor codeの部分を好みに変更して、my_styleとして描画してみます(dfはあらかじめ読み込んであるものとして。)。
import pandas as pd     #pandasをpdとして読み込む
import mplfinance as mpf  #mplfinanceをimport

my_style = {'base_mpl_style': 'fast',
         'marketcolors': {'candle': {'up': '#d7003a', 'down': '#5383c3'},
                          'edge'  : {'up': '#d7003a', 'down': '#5383c3'},
                          'wick'  : {'up': '#ffffff', 'down': '#ffffff'},
                          'ohlc'  : {'up': '#d7003a', 'down': '#5383c3'},
                          'volume': {'up': '#d7003a', 'down': '#5383c3'},
                          'vcedge': {'up': '#d7003a', 'down': '#5383c3'},
                          'vcdopcod': False,
                          'alpha': 0.9},
         'mavcolors': None,
         'facecolor': '#1f1f1f',
         'gridcolor': '#808080',
         'gridstyle': None,
         'y_on_right': True,
         'rc': {'axes.edgecolor': '#f8f8ff',
                'axes.grid'     :  True,
                'axes.grid.axis': 'y',
                'grid.color'    : '#000000',
                'grid.linestyle': '--'
               },
         'base_mpf_style': 'None'
        }

fig_scale = 0.6
fig_ratio = (8.00,5.75)

mpf.plot(df, type='candle', style = my_style, figscale = fig_scale, figratio = fig_ratio, volume = True, mav = (5, 10))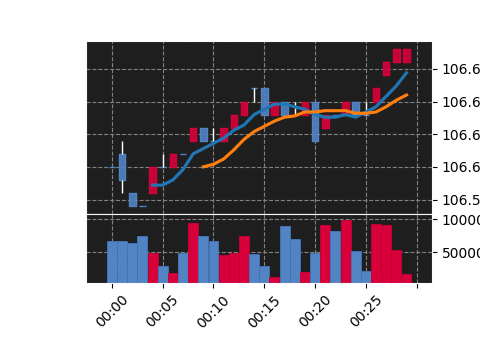
これでよし、と。
ちょっと広告です
https://business.xserver.ne.jp/
https://www.xdomain.ne.jp/
★LOLIPOP★
.tokyo
MuuMuu Domain!
Python; 3.7.2
pandas; 1.0.5
mplfinance; 0.12.6a3
にて実施しました。
このブログはエックスサーバー
WordPressを使うならロリポップ!
簡単インストール完備で楽々スタート!
世界にたった一つ、あなただけのドメインを登録しよう!
格安ドメイン取得サービス─ムームードメイン─